Toronto food content people actually save.
Hands-on food reviews from around Toronto, filmed and voiced by me. For cafés, restaurants and food brands.
2.9 percent
save rate
About 1 in 35 viewers saved it.
9.2 percent
engagement rate
TikTok average is 3.85%.
221.8K
views on eight posts
Since I started in October.
72.5K views and 2,093 saves.

I'm Jaspreet.
I live in Toronto, cover the whole GTA, and started posting food reviews in the second week of October 2026.
You'll mostly see the food or drink and my hands, and sometimes my face to introduce it or react to the first bite. The place is always the star.
Who are you?
Cafés
Café Fix Friday features for cafés and bakeries.
Restaurants
Features for restaurants and food spots.
Brands
UGC and partnerships for food and drink brands.
Top recent posts
My most saved posts since October. Tap one to watch it here.
What happens after people watch
I started posting in the second week of October 2026. Under five weeks in, this is what my posts are already doing.
People save it to go there.
6,533 saves and 3,039 shares on eight posts. A save is a plan to go. A share is a plan to go together.
For every 100 likes
60saves
28shares
One square, one like
People engage with it.
9.2% of viewers liked, commented, shared or saved. That's 2.4 times the TikTok average.
It shows up when people search for food.
These searches led people to my posts. Some look up a spot by name; most search broadly.
 best restaurants torontoLed people to Date night spots
 best dessert torontoLed people to Little Pebbles Cafe
 dessert torontoLed people to Dessert spots
 must try fast food torontoLed people to Fast food and sandwich spots
 spaghetti western toronto locationLed people to Spaghetti Western
See the numbers by post
Carousels get saved twice as often as videos.
Saves for every 100 views.
Photo carousels4.7%
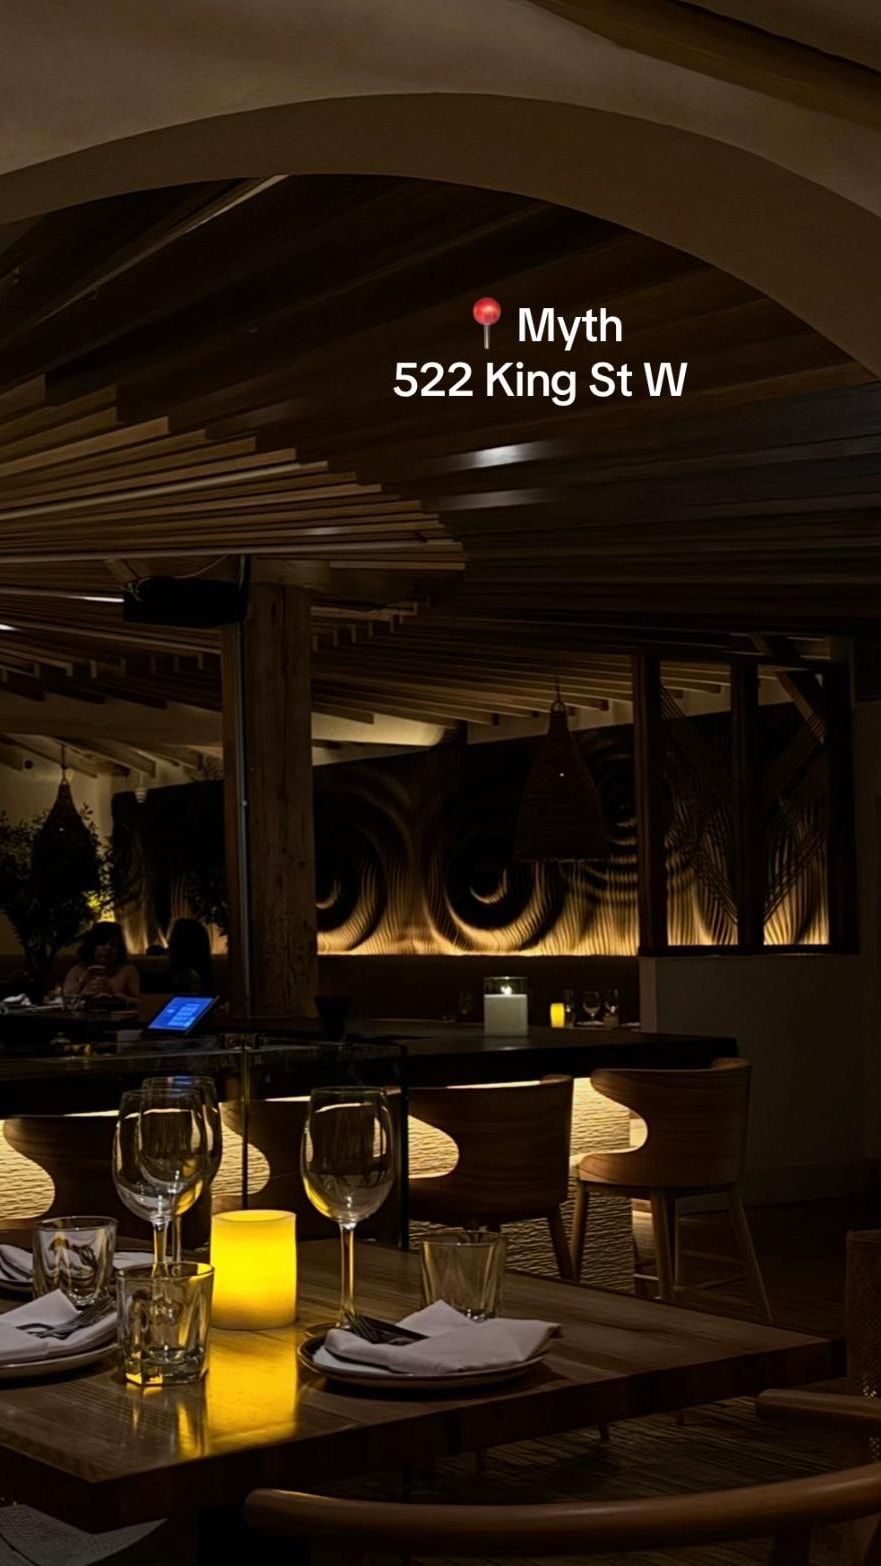
 Date night spots5.9%
 Dessert spots2.4%
 Fast food and sandwich spots1.3%
Videos2.3%
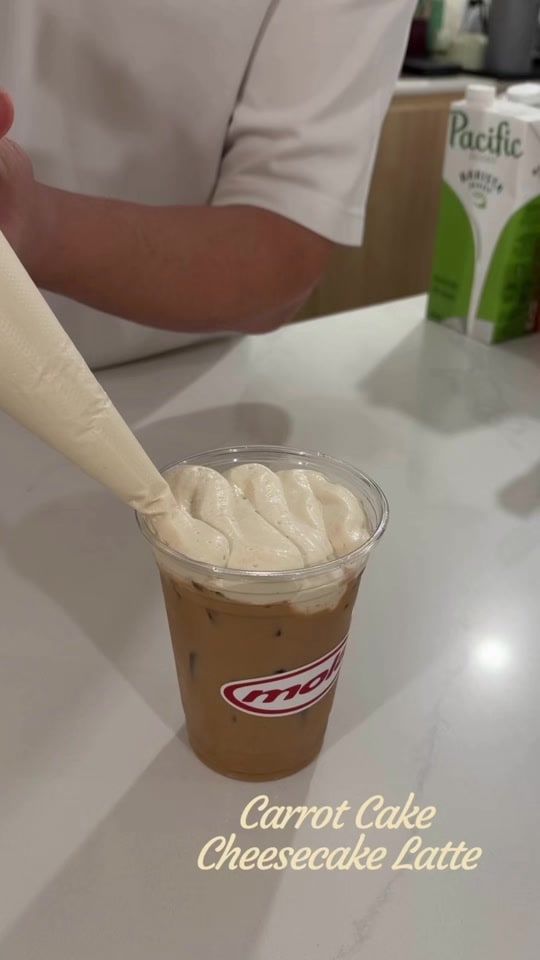
 Café Fix Friday Episode 3: Mola Café2.9%
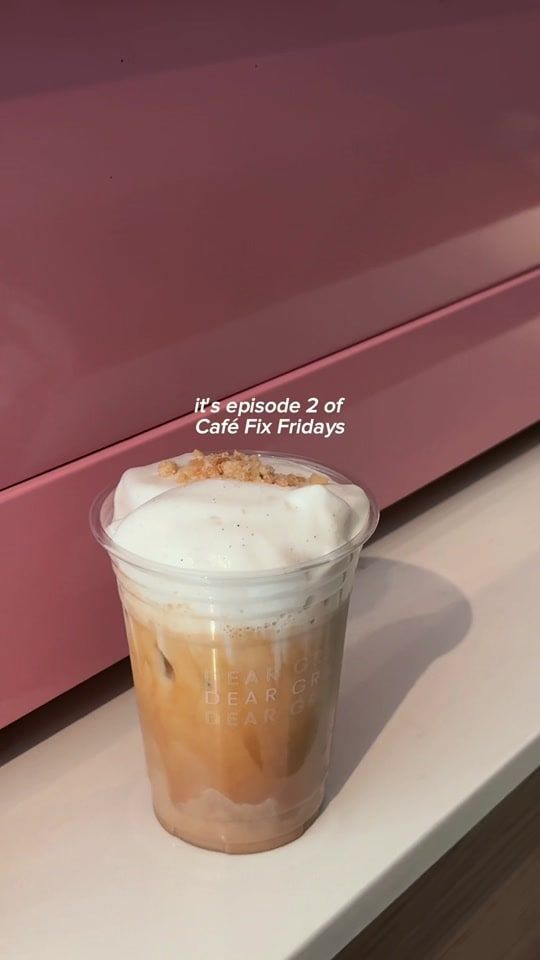
 Café Fix Friday Episode 2: Dear Grain2.9%
 Spaghetti Western2.2%
 Little Pebbles Cafe1.3%
 Vero Italian Sandwich Co.0.4%
The totals.
Eight posts, Oct 15 to Nov 6
- Views
- 221.8K
- Likes
- 10,851
- Saves
- 6,533
- Shares
- 3,039
- Comments
- 148
- New followers
- 296
Whole account, every post to Nov 9, 2026
- Views
- 416.4K
- Likes
- 16,046
- Shares
- 3,753
- Comments
- 266
- Posts
- 39
- Top post
- 72.5K views
How these are counted
- Eight posts published Oct 15 to Nov 6, 2026. Views, likes, comments and shares are live from TikTok, updated Nov 9, 2026. Saves, new followers and viewer details are from TikTok Studio, read Nov 9, 2026. Newer posts have had less time to grow.
- Save rate is saves divided by views. Engagement is likes, comments, shares and saves divided by views. Both use the views from the day the saves were read, so they compare like with like.
- Searches are TikTok's search queries that led viewers to each post.
- Viewer details (country, age, followers, For You) are from the seven posts I've read them for.
- Whole account figures are live from TikTok and cover every public post since I started. The TikTok average engagement (3.85%) is from TikTok benchmarks, Socialinsider, first half of 2026.
Email me
Replies within one business day.
Couldn't copy. Select the address above.